

What Your LED Fixtures Are Really Doing After Year One


Every LED spec sheet has a lifespan number on it. Most of the time it's an L90 rating, meaning the point where the fixture has dropped to 90 percent of its original lumen output. Sounds like a solid benchmark. It isn't, not for growing anything.
Lumens measure how bright light looks to a human eye. That's a useful number for an office or a warehouse. It tells you almost nothing about what a plant is actually receiving. A fixture can hold its lumen rating just fine while the spectrum underneath it quietly shifts into territory a crop was never designed around.
L90 vs. Q90
Q90 is the number that actually matters here. It measures quality maintenance to 90 percent, which covers both total output in the usable PAR range and spectral quality. That second piece is where things get interesting. A lot of white diodes use a phosphor coating that degrades over time, and as it degrades, the output shifts back toward the blue diode underneath it. Your PAR meter can look fine while your spectrum is quietly moving somewhere you didn't plan for.
Typical fixture-level L90/Q90 ratings sit around 50,000 hours. Some individual diodes are rated higher at the component level, and a few fixture brands are marketing higher numbers at the fixture level. Worth checking those claims fixture by fixture rather than taking them at face value, since a component rating and a fixture rating are not the same thing.
There's another wrinkle worth knowing about. DLC listings are sometimes built on a best-case sample rather than what actually ships. A manufacturer might submit a unit testing at 3.2 micromoles per joule when typical production is closer to 3.0, which is still a strong number, but it's not the number you'll actually get. Sustainable Terrains builds a production variation buffer, roughly plus or minus 5 percent, into its lifecycle modeling to account for exactly this.
Why You Don't Notice the Loss Right Away
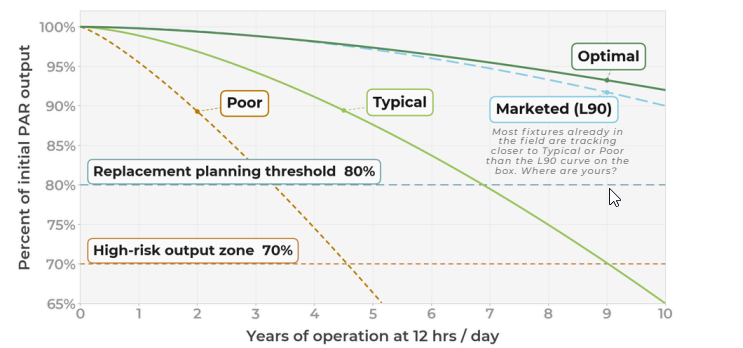
Here's the part that catches most operations off guard. In commercial settings, most growers aren't running anywhere near the theoretical output ceiling for their crop. There's a real gap between what a fixture is capable of and what a facility actually uses, and that gap is what hides early degradation. You don't lose yield the moment output starts to drop, because you weren't using every photon to begin with. You lose yield once output falls far enough that light itself becomes the limiting factor.
By the time that shows up in your harvest, the fixture has already been degrading for a while, and not on a straight line. It's an accelerating curve. Sustainable Terrains uses 80 percent total output retention as the trigger point, not because that's when problems start, but because that's the point where waiting any longer stops being a safe bet.
Spectral shift adds a second layer to this. If white diodes are drifting blue as the phosphor wears, red to far red ratios and the overall spectral recipe can change before total output ever drops to 80 percent. Morphology and yield changes can show up before the output number tells you anything is wrong.

How the Assessment Actually Works
A grower ships one to three fixtures, ideally three for a good average, to Sustainable Terrains' DLC-approved lab partner. The lab captures a spectrum snapshot and an output snapshot. Sustainable Terrains compares that against historical DLC data or manufacturer specs, applies the production variation buffer, and puts together a lifecycle position report.
That report lands one of two ways.
Best case: fixtures are still at 90 percent output after 30,000 hours, with four or more years of usable life ahead. That's capital planning confidence, not a guess.
Action case: fixtures are sitting at 83 percent. No visible yield loss yet, but the window before there is one is about 12 months. That's the signal to start planning a phased replacement now, while there's still time to do it on your own terms.

The Money Side of This
You can't hang 500 fixtures in a single day, and you shouldn't want to. Knowing where a fixture sits on its degradation curve lets a facility spread that capital expense out, replacing 100 fixtures at a time instead of getting hit with a surprise seven-figure lighting upgrade all at once.
There's also a rebate angle worth tracking. If LED output degrades below the efficiency of legacy HPS, roughly 2.0 to 2.2 micromoles per joule, a facility may become eligible for utility incentives to upgrade to higher-efficiency LEDs, even if it wasn't eligible originally or already went through a prior rebate cycle. Rebate funding overall isn't what it used to be, but the eligibility pathway still exists and is worth checking.
Some manufacturers now offer warranties tied to output dropping below 80 percent. Good in theory. Nearly impossible to prove in the field without independent, unbiased documentation. That documentation is exactly what this assessment produces.
The Point of All This
Lighting is infrastructure, the same as HVAC or a fertigation system, and it needs the same kind of maintenance planning over its useful life. LED just runs on a much longer curve than most people are used to thinking about. Advertised specs and marketing claims are one thing. What a fixture is actually delivering after real hours in the field is another. Sustainable Terrains' LED Lifecycle Assessment exists to close that gap with real data, not another spec sheet.


Comments